OpenSprinkler › Forums › Hardware Questions › OpenSprinkler › View log problems in 3.0 DC with Firmware 2.1.7
Tagged: logs 3.0 DC
- This topic has 32 replies, 8 voices, and was last updated 8 years, 4 months ago by
Ray.
-
AuthorPosts
-
July 8, 2017 at 5:30 pm #47044
massimiliano.casiniParticipantHello,
At the moment I can not see the logs. The page always in loading.
My opensprinkler is 300 Km away fro mmy house …
In HW 3.0 the SD card is default installed?
I have opened ticket to support since 2 days …
Can anyone suggest a solution?
Thanks, regards
Attachments:
July 8, 2017 at 6:40 pm #47054
richardgedwardsParticipantI’m having a bit if trouble responding. So here I go again. Try this Link
Just keep in mind you will lose your data.
July 10, 2017 at 2:47 am #47070
massimiliano.casiniParticipantI will try as soon possible.
Thanks
July 12, 2017 at 3:54 am #47095
massimiliano.casiniParticipantHi Richard,
at the moment the problem is solved called API with parameters:
http://xxx.xxx.xxx.xxx/dl?pw=****&day=all
You know from what may depend on the log crashed?
Best Regards
July 12, 2017 at 6:48 am #47096
GregoryNeefsParticipantSame problem here with AC version. Loading the logs won’t work.
It keeps loading and then it’s telling me there is an error.I’ve just cleared the logs now. Let’s see what it does…
July 12, 2017 at 2:20 pm #47098
richardgedwardsParticipantI don’t know what causes the log crash, however the problem began for me after I installed a flow sensor and enabled it. Hopefully someone who knows a bit more about the firmware will respond.
July 24, 2017 at 10:13 am #47251
RayKeymasterIf the logging problem started after installing a flow sensor, then I suspect the issue is that there is too much log data that exceeded the flash memory space allocated to data storage (which is 1MB by default). If you have a way to roughly estimate how much there there is on an average day, please let me know so we can figure out how much data is accumulated. We will probably have to implement a way to erase old log data when too much is accumulated. Of course there is also the possibility that the SPIFFS (flash) library has a bug causing this, which we can investigate further.
July 24, 2017 at 4:15 pm #47259
Marco83ParticipantI have the same issue!
Where is the SD card located on 3.0?July 25, 2017 at 2:39 am #47263
massimiliano.casiniParticipantAfter ten days of normal functioning in which I saw the logs, starting from today they are blocked again.
Now I have performed the reset again and I will see if the logs will work properly again.
The ten connected stations are started in average one time a day so I have about ten events per day. Could you please simulate this scenario in your lab as well? Is it possible that nobody has the same problem? How amount the storage memory for logs 1 or 3 MB?July 25, 2017 at 7:32 am #47270
richardgedwardsParticipantThis seems consistent with what I have also seen. Ill also reset mine again and see if i can tell when the problems start to occur.
July 25, 2017 at 11:08 pm #47282
PeterParticipantOK, so I too had this problem. I took a look at the logs on my OSPi and found a few strange entries across the last 6 months of files:
[254,4,120,1485693673, inf]
[99,4,120,1485696549, inf]
[99,4,120,1485697194, inf]
[99,4,120,1485698351, inf]
[4,4,108,1486404109, inf]
[4,4,117,1487008918, inf]If you have a flow meter enabled then the final field should be the flow rate associated with the station run. I think the “inf” could be the result of a divide by zero error and the log entries are rejected by the App and trigger the UI error message. Removing these lines resulted in successful logs being displayed for me in the UI. Looking at the code, this could happen if you have a Flow Meter enabled and short duration/low flow runs (my station 4 is just a single dripper for < 2 minutes).
I would be interested to know if this is the same issue as mentioned above and in #46873. To check, on OSPi, you can login to the Pi, change into the log directory and type “grep inf *” to see if any of your logs have this. On OS (and OSPi), you can use the web api to download all of the logs by typing “http://os_ip:8080/jl?hist=300” into a web-browser (may need MD5 password hash if enabled) and take a look. You can then delete just the individual daily files rather than the entire log history. Let me know.
July 28, 2017 at 3:42 pm #47323
RayKeymasterThanks Peter, for posting your findings. It sounds like the inf value associated with flow sensor may be the culprit. I can talk to Samer to quickly get the UI updated to avoid this issue, and in the next firmware prevent such inf values from being written to the log.
By the way, OS 3.0 does not have a built-in SD card, instead, it write log files to its internal flash memory space. So no SD card necessary.
August 8, 2017 at 6:55 am #47397
Fabien NaudyParticipantHello,
I have the same problem that you.
In my case, my OpenSkrinkler reboot after few seconds when I try to read logs.
I have no idea to fixed the problem.
See my topic https://opensprinkler.com/forums/topic/restart-when-i-read-the-log/September 18, 2017 at 6:57 am #47730
RayKeymasterI’ve just responded to you in the previous thread:
https://opensprinkler.com/forums/topic/restart-when-i-read-the-log/#post-47729January 12, 2018 at 10:02 pm #48682
PeteParticipantTen days ago I thought this thread had solved my problem, but now I seem to be back at square one.
I have a v3.0 DC controller configured with one expansion board, controlling 20 stations all up. I have six individual programs running on a seven day cycle, with a mix of sequential and non-sequential stations. I don’t think there’s anything else special about my configuration—no other sensors or anything like that.
As I recall, everything worked as expected for about the first 16 days (based on the log entries that I have managed to save). Then, on the 17th day, I was unable to display any log entries through the web interface. I didn’t know whether or not this may simply have been related to something I did in the set-up phase (the problem was with a newly installed controller) so, after retrieving the log entries via the API (they were all there, just not displaying through the web interface), I cleared the logs (per advice in this thread) and all was well… for about another 8 days…
This morning I went to check the log, as I have done on a more or less daily basis since I cleared the logs (on Jan 4) and received the “Nothing to display” message. I then tried to retrieve the logs through the API but this time there was nothing there either.
I ran a program manually, just to see if anything was actually being logged, and sure enough, there was a log entry, but only this one, most recent entry.
The previous log file I managed to save contained 199 entries. By my estimation there would have been less than 100 entries in the log as of yesterday.
If I knew I had to save the log file periodically, I could probably live with that (although it’d be nice not to have to do that more often than about once a month), but this doesn’t look like an ‘overflow’ problem. In the most recent case, the log has actually been deleted. Could I have deleted the log inadvertently? Well, anything’s possible, but I really don’t think I would have.
Has anyone else following this thread seen anything similar, or is it just me?
I do recall reading somewhere that the log entries are kept for something like one year. What happens then? Are just the year-old entries deleted? Could there be a problem with this process that is leading to premature deletion?
January 22, 2018 at 9:36 pm #48753
PeteParticipantIt’s happened again. That’s about 10 days again, for about 115 log entries.
I have been able to retrieve the log entires via the API, but the web interface loops indefinitely (displays the OpenSprinkler circling grey disc) and displays “No entries found…” if I try to switch between Timeline and Table.
I have now also just noticed this problem with a second OpenSprinkler that I’ve been using to fiddle around with generally. It’s not connected to anything, just idling away. I’ve been able to view its logs (which are just a couple of events I triggered manually) up until this morning. Its earliest entry is Jan 2 (again, I can retrieve them throught he API), and there are only five of them in all.
On the off chance that someone suggests that this is a ‘host software’ problem, I’m using a Mac (OS X 10.11.6), and I’ve tried Safari (11.0), Firefox (57.0) and Chrome (63.0.3239.132), and they all do the same thing, so…?
February 8, 2018 at 10:20 pm #48854
PeteParticipantI just let things go (i.e. didn’t delete log entries or anything) after my last post (Jan 22) and then, a couple of days later, the log entires started displaying again. Now I can display the last 7 days’ entries (the default), but if I try to display any more (i.e. extend the start date back to Jan 23—when I last cleared the log—or anything beyond 7 days earlier than the current date—anything less than 7 days is fine) all I get is the grey spinning wheel. They can all be accessed via the API OK, so there are more [than just 7 days’ worth] there.
If I switch from Timeline to Table display mode, the Table is actually displaying entries for the last 9 days, even though the Options request only the last 7 days. It may be coincidental, but the oldest event in the Table list is a Rain Delay that I entered manually, 9 days ago. I do note that, in my case, Timeline mode seems to display its entries counting back from the current time, while Table mode seems to display entries counting back from the last log entry (which, in my case, is most often the previuos day), but ewven that doesn’t explain why, in this case, Table mode is displaying data (albeit just the Rain Delay event) from 9 days ago.
Also, the ‘Table Station Events’ count in either Timeline or Table mode seems to be the number of events displayed in Table mode, which as noted above is often not the same as the number displayed in Timeline mode.
With all my recent testing, it seems that any time I encounter the spinning grey disc, I simply go back to the main screen, reload (which seems to reset the date range to 7 days), and select ‘View Logs’ again. At least that’s the way things seem to be working now. I could reason that that process would cause a reload of any code that’s got itself stuck in a loop somewhere, which is what seems to happen when I try to extend the display date beyond 7 days.
February 10, 2018 at 12:46 pm #48861
PeterParticipantPete, not sure if I can help but if you could attach a copy of your log (accessed via the API right back to 23 Jan) then happy to try and replicate the situation on my development system. I’m on OSPi so not quite the same setup i.e. SD card vs SPIFFs but we might get lucky. Peter
February 10, 2018 at 5:18 pm #48862
PeteParticipantThanks. Log file attached.
I’ve just fiddled a little more with the display date range. I don’t think the Rain Delay entry has any thing to do with anything. What I’ve discovered I am able do now is display only up to a 7 day period. If I try to reset the Start date, effectively extending the period beyond 7 days, I get the spinning disc. However, if I alter the end date first, bringing it back so that the range is less than 7 days, say just 5, the shorter log is displayed OK. If I then alter the Start date to be no more than 7 days before the End date I get 7 days worth of log. If I try to set the Start date beyond 7 days before the End date, I once again get the spinning disc.
This seems to work consistently. If I steadily adjust the End date, then the Start date so that the two are never more than 7 days apart, I can get back to the start of the log.
Attachments:
February 10, 2018 at 7:32 pm #48865
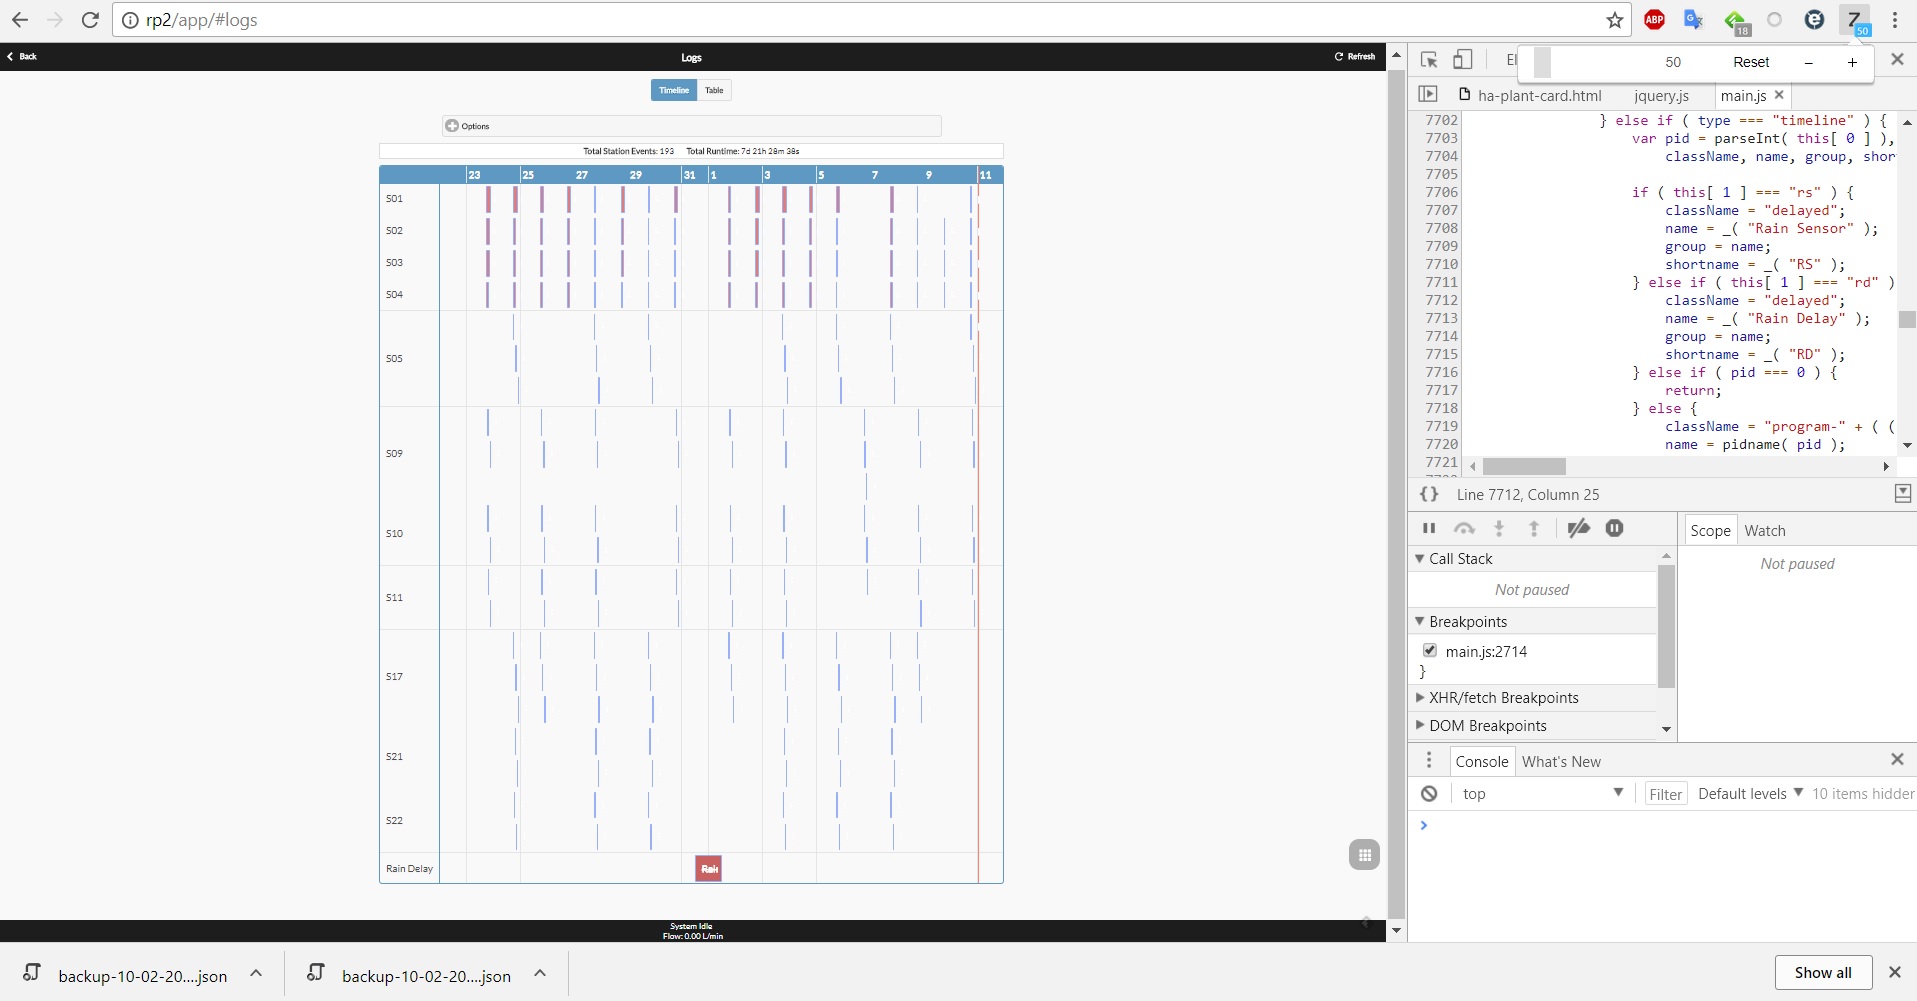
PeterParticipantPete, So, I configured my OSPi for 6 programs and 22 stations to match your log file. I stored the records in the OSPi log directory and used the App interface to display the log from 22/01/18-11/02/18. The timeline view and the table view both showed 193 records which corresponds to the number in the log file (note the rain delay event correctly shows up in the timeline/table but is not included in the count as per the code). There were no errors flagged in the debug log from the Firmware nor any issues highlighted within developer tools from the App. I have attached a screen shot of the log view. I am unfortunately unable to replicate the situation you describe. This may be down to the different hardware but the code (apart from reading the SPIFFs vs SD card) is pretty much the same.
One question, did you pull the records via the View Logs Export button in the App or did you capture the records by typing “http/os_ip:8080/jl?hist=300” into a web browser? The file you attached suggests the former but I was wanting the latter. The feed provided by the http command is a “raw” feed from the log files whereas the View Log Export is a more processed list.
As one suggestion, given you have Chrome browser, have you tried having the Developer Tools open (…/More Tools/Developer Tools) when displaying the log. You may get lucky and see an error message that helps point to the problem.
Attachments:
February 10, 2018 at 9:00 pm #48868
PeteParticipantI pulled the records via the API (http:/os_ip/jl?hist=21) and just cut & pasted them from the browser into the file that I forwarded.
I’ve looked at the Developer Tools under both Safari and Chrome and I can’t really see anything that seems relevant. Chrome throws up a warning about an SSL certificate that won’t be trusted in some future release, but there’s nothing in the Safari log.
And after all the fiddling around, the OpenSprinkler unit in question will now not show any log entries, regardless of the date range. I’ve even gone and power cycled the unit, but still no log display (at all), although everything’s still accessible via the API. I’m running five units and the other four are displying their logs on request (same computer, same browser, just different tabs; same on an iPad using the App) just fine, although they only have five days of entries at the moment.
I have some network sniffer software somewhere, so I’ll see if I can dig that up and see if the network traffic provides any hint as to what might be happening.
Note that all of these are just OS V3.0 hardware, no OSPis.
February 11, 2018 at 1:46 am #48873
PeteParticipantI just posted a rather lengthy response based on my network sniffing efforts but it seems to have disappeared… If it reappears, my applogies for any duplication.
In sumamry, the problem appears to be with the ‘type’ parameter in the ‘jl’ command. The command being sent to the controller to view log entries is of the form:
GET /jl?pw=a6d82bced638de3def1e9bbb4983225c&type=wl&start=1517662800&end=1518353940&_=1518315941796 HTTP/1.1..Host: <controller IP address>..Accept-Encoding: gzip, deflate..Connection: keep-alive..Accept: applicat
I’ve never used the ‘type’ parameter in my API requests, so I’ve never encountered the problem there, but if I include “type=wl” in any API Command I send to my problem controller, I end up with the same result: no log entries. Leave out the “type=wl” parameter, and log entries appear. Any other value for ‘type’ is fine too, it’s only “type=wl” that’s a problem.
As noted, this is only a problem for one of my (five) controllers, but this is the most heavily configured unit, currently also with the largest log. The others have only been in operation for about four days, they are not as heavily configured, and they haven’t yet accumulated many log entries.
When I monitor the packet stream on the network, I can see the request (as above) sent to the controller (whether via the web interface or an API request that includes the “type=wl” parameter), I can see the controller acknowledge receipt of the relevant packet, but then nothing for about 10 seconds. Then the controller sends an ARP request to itself, then an IGMP Group Membership report. My Mac then sends a string of ARP requests to the controller until it responds. Provided the web interace isn’t hung up waiting for the never-to-be-received log entires, the controller then continues chattering as it appears to do under normal circumstances, sending perioidic status updates.
But the display log request appears to have been lost, which is not surprising if the controller has somehow lost its network connection. This is what appears to have happened, for some reason. It recovers OK, and fairly quickly, but not without loss of the connection that was being used for the disply log request. Unfortunately, the browser software doesn’t timeout or pick up the fact that the connection has been lost and just sits there waiting.
The problem controller does hang off a WiFi range extender, but so too does another (off the same extender) that is operating without any problem.
It might be tempting to suggest that this is a hardware problem, controller or network, since only one of my controllers is showing the fault. But all I have to do is remove the “type=wl” parameter from any request and it works as expected. And to date it is only ‘jl’ requests that include the “type=wl” parameter that trigger the connection failure and subsequent ARP requests.
But it’s pretty flakey. Even they ‘jl’ requests that include “type=wl” don’t always fail on the problem controller… Up until this morning, they were fine as long as the date range stayed within 7 days. But something [else?] happened today, and here we are.
February 11, 2018 at 6:47 am #48877
PeterParticipantWhat you should be seeing on the network via wireshark is three API log commands coming from the App. One is for all water level log records by specifying the “type=wl”. Another is for all flow records with “type=fl”. And another for all other records by leaving the type filter off. The App then puts the three sets of data together to display the timeline/table. This is not particularly clear in the API specification but is consistent in the firmware and app code. Although I recall seeing a reason for splitting the request into three, I cant locate it at the moment. It may just be historical as “wl” and “fl” logging may have been added at a latter point in time.
For completeness, I should have suggested to do the same three commands from the browser (i.e. to also try “http:/os_ip/jl?&hist=21&type=wl” and “http:/os_ip/jl?hist=21&type=fl”). If you don’t have a flowmeter configured then the “fl” call should return “[]” and if you dont use a weather adjustment method then the “wl” call should also return “[]”. If you do have a weather adjustment method setup (i.e. via weather underground) then you should be seeing entries of the form “[0,”wl”,75,1493943439]” which represents 75% watering times.
Be good to check that these calls return valid data as well. From your comments above it sounds like you tried “http:/os_ip/jl?&hist=21&type=wl” from the browser but got no response rather than a “[]” response? If that is the case then there may be a firmware/hardware-side issue. Also, can you confirm your settings for flow meter and weather adjustment so we know what we should be seeing.
If the problem is network related then a few things worth trying. Firstly, it would be good to know the signal strength of the wifi connection between the unit and the extender. From memory the OS 3.0 creates an Access Point at boot time that you can connect to and scan the network. You might be able to see the signal strength for your extender’s SSID from there. Secondly, can you “ping” the unit from your mac and see what the delay time is. I connect to my OSPi via wifi->ethernet->powerline->wifi which is quite a trip and has a long ping of around 250ms but with no packet loss. Thirdly, it would be worthwhile relocating the unit near your primary wifi controller and again via the OS 3.0 Access Point connect the unit to the main wifi, i.e. remove the extender from the equation, and retry all of the tests. Finally, it might be worth swapping two of your units with each other (use export/import config from App to help) to see if the problem follows the unit or stays with the location (but this would require take a week to build up a sufficient log record.
Let me know how you get on.
February 11, 2018 at 9:00 am #48878
PeteParticipantYep, OK, when things work there are indeed three API commands as you suggest. The first, type=wl command returns a stack of records of the form [0,”wl”,100,1517618908], many more than the number of log messages returned by the ‘no type’ command. The second, type=fl command result is empty (just “[]”), and the third ‘no type’ command returns the log entries as I posted previously.
When things don’t work, the problem occurs with the first, type=wl command and never proceeds beyond that. If I use the API directly, the type=wl command hangs, as described previously, the type=fl command just returns the empty set “[]”, and the ‘no type’ command returns the log entries.
The problem certainly seems to be with the controller and/or its software, noting that the only thing that results in the ‘hang’ or ‘network disconnect’ is a jl command that includes the “type=wl” parameter.
The signal strength is fine as measured by the OS X Wireless Diagnostics tool—remember there are two controllers running off the same extender, and the one that is failing is only a couple of metres away from the extender (the other one is 10-15 metres away). Ping delay times are typically 5-10ms.
Unfortunately it’s not practical to move the controller anywhere else, because that’s where all the control wires come in. Remember, there’s another controller, using exactly the same network path, that is working just fine. But yes, pretty much the only thing left to do is to swap in another controller. But I’ll wait a couple more days and see if the same problem occurs with the other controllers when their logs fill up a little.
Now, in running those API tests above, I noted that there are many, many more “type=wl” entries than there are ‘regular’ log entries returned. In one of my controllers there are just four log entries returned, but 105 “wl” records. In another there are 62 log entries and 189 “wl” records. So just on a hunch, I reduced the Start time on the jl command I sent to the problem controller right down so that the command returned only a couple of log entries and the API “type=wl” command worked! There does not, however, seem to be any way of setting the Start date on the web interface without first initiating the View Log command, and that results in the ‘hang’.
So it seems that the problem is that, on the controller that is causing the problem, there are too many log entries in the default, one week period. This would be entirely consistent with the previous observation that I could not retrieve more than 7 days worth of log entries. The 7 days may well just be coincidental and it’s really the number of log entries that is the limiting factor, although they will pretty much increase, perhaps not exactly linearly, with the number of days. The problem is not the log entries themselves though, because we can retrieve them through the API. The real problem seems to be the number of entries generated by the “type=wl” parameter because, if we reduce the Start time sufficiently, the jl command will work with the “type=wl” parameter.
February 11, 2018 at 3:37 pm #48884
PeterParticipant——- Wow, the forum just deleted my post as well ! I’ll try not to take it personally and hopefully this wont be duplicated ————
Hmm … OK, so a bit more on the inner workings of Firmware. The three log api calls all operate in a vary similar manner. In each case the OS is reading every entry from the log within the date range. In the case of the “no type” call, it will discard any “wl” and “fl” readings. In the case of “fl” and “wl” types, they discard anything but the specified type. So in this way the OS is reading the log from SPIFFs the same in in all three cases. If there was a SPIFFs problem then I would have thought all three responses would be impacted. Given that only “wl” is effected then it appears that’s not the problem.
But to rule out any possible data corruption of the “wl” log entries causing problems, have you tried doing a full “walk” of the log history using overlapping bite-sized “wl” requests. If you can cover the full range and the records look well formed then that should rule out data corruption in the “wl” records much the same as we have done for the others.
As you point out, a big difference between the three commands is the size of the response. The “wl” entry happens every hour and so there should be, give or take, 24 entries per day. In many setups this could be perhaps an order of magnitude more entries than station events. Thus the response from the “wl” query could be a larger packet. Having said that the buffer on the ESP8266 is 4k and will segment the response if needed. Hence a buffer overrun seems unlikely but not impossible. In one of your earlier responses you mention network connection problems coinciding with a large “wl” request. How consistent is this behaviour (i.e. always at a certain number of records) and is there any indication that the OS is resetting at this point?
So barring the above, I am kind of left with suspecting a network problem. An alternative way to get the OS view on wifi signal is to issue “http://os_ip/jo” command and look for the RSSI field in the returned json string. I know you have a couple of units and one works well on the wifi extender but I am bit old school and always keen to remove variables when testing. You wouldn’t need to have the expansion module/valves connected to do a bit of api testing just a strong connection to your main wifi router. But that’s easy for me to say as I don’t know how hard it is to “just 8-)” disconnect everything so your call.
UPDATE: I think the command to get RSSI is actually “http://os_ip/jc” but just going from the code on that one.
-
AuthorPosts
- You must be logged in to reply to this topic.
OpenSprinkler › Forums › Hardware Questions › OpenSprinkler › View log problems in 3.0 DC with Firmware 2.1.7