OpenSprinkler › Forums › OpenSprinkler Unified Firmware › Corrupted JSON Responses and ‘Network Errors’
- This topic has 11 replies, 2 voices, and was last updated 5 years, 3 months ago by
Ray.
-
AuthorPosts
-
March 29, 2021 at 4:18 pm #69563
DaveCParticipantI am testing my automation application. The app primarily monitors the OS and relies on the phone and web app to do most of the configuration work. I am experiencing 2 failure scenarios that could be related: Corrupted JSON message data and ‘Network Errors’.
My config and version info:
OS 3.2 DC FW 2.1.9(3)
App: 2.2.1
OS and the automation controller running my app are connect to the network via EthernetMy app polls OS at periodic rates depending on the request type. I use the /JC, /JO, /JN and JP requests. To experience the 2 failures, I connect with either the phone app of the web app to make a configuration change. After some period of time my app will get some message timeouts and retry failures trying to talk to OS. My app waits 5 secs for a response. If none comes back it will try again once. If that retry fails after 5 secs, the request fails.
Corruption symptom:
After one of these failures, when I do get a response from OS it may be corrupt. It can occur with any of the 4 requests that I make. The form of the corruption is a string of 16 bytes that overwrite 16 bytes in the response message starting at position 363 from the start of the JSON response message. The 16 byte overwrites are not all exactly the same but look like:
\xD7\xD3\xD3\xD3\xD3\xD7\xD3\xD7\xD3\xD3\xD3\xD3\xD3\xD3\xD7\xD2
The high nibble is always D. The lower nibble has been predominantly 3 or 7 but I have seen a 2 and a B.
I can provide full examples of correct responses and the corrupt ones for each message if helpful.‘Network Error’ symptom
When I see timeouts, the phone app and the web will typically show ‘Network Error’ in the bottom bar. The app may still appear to operate or it may appear hung with a busy icon. In one case the OS controller hung. It would not respond an a B2 reboot. It recovered after a power cycle.I have data on a number of instances of the above failures and can reproduce them relatively easily. Sometimes in as little as 10 minutes.
My use case may be somewhat unique but have others seen similar phone or web app symptoms?
Ray, is there something else that I can provide that would help in figuring out what is happening in OS?
Dave
April 1, 2021 at 1:35 pm #69605
RayKeymasterI am not entirely sure what causes the corruption, it might be a flash memory corruption issue. But in all cases I’ve seen, the corruption can be fixed by sending a API command to correct the json variable that’s corrupted. For example, if station 1 name is corrupted, you can use openSprinkler API to send a command to reset station 1 name and this should fix the issue.
April 1, 2021 at 2:53 pm #69608
DaveCParticipantThe corruption is transitory and only in the response messages. I think the corruption is just a symptom or byproduct of the issue I’m concerned about, that OS has a problem dealing with 2 clients talking to it at the same time.
The 16 byte overwrite is in the JSON response from OS but the underlying data in OS must still be correct because the responses will eventually return to being correct, even if OS has to be rebooted because of the hang.
I’ve been able to create the same ‘Network Error’ message in the apps and OS lockup using only the phone app and the web app. As with the previous lockup, OS had to be power cycled to bring it back.
Using the phone and web apps at the same time is just a way to reproduce the problem. I understand that would not be typical use, but I do need one of them to be able to run while my monitoring app runs.
The 16 byte overwrite is not limited to a specific field, like a program name. It occurs in each response message starting at character position 363 which means it will hit a variety of fields, including keywords. I thought that the overwrite being in the same place and the nature of the data pattern might help in understanding the underlying issue.
Dave
April 6, 2021 at 1:05 pm #69669
RayKeymasterHave you tried to update your firmware to the latest 2.1.9(7)? You said yours is 2.1.9(3) which is several minor revisions ago.
April 6, 2021 at 6:45 pm #69672
DaveCParticipantI updated to 2.1.9(7)
After doing the update, I reconnected my Ethernet module and rebooted OS.
I then went to the web app to see if I needed to import my config.
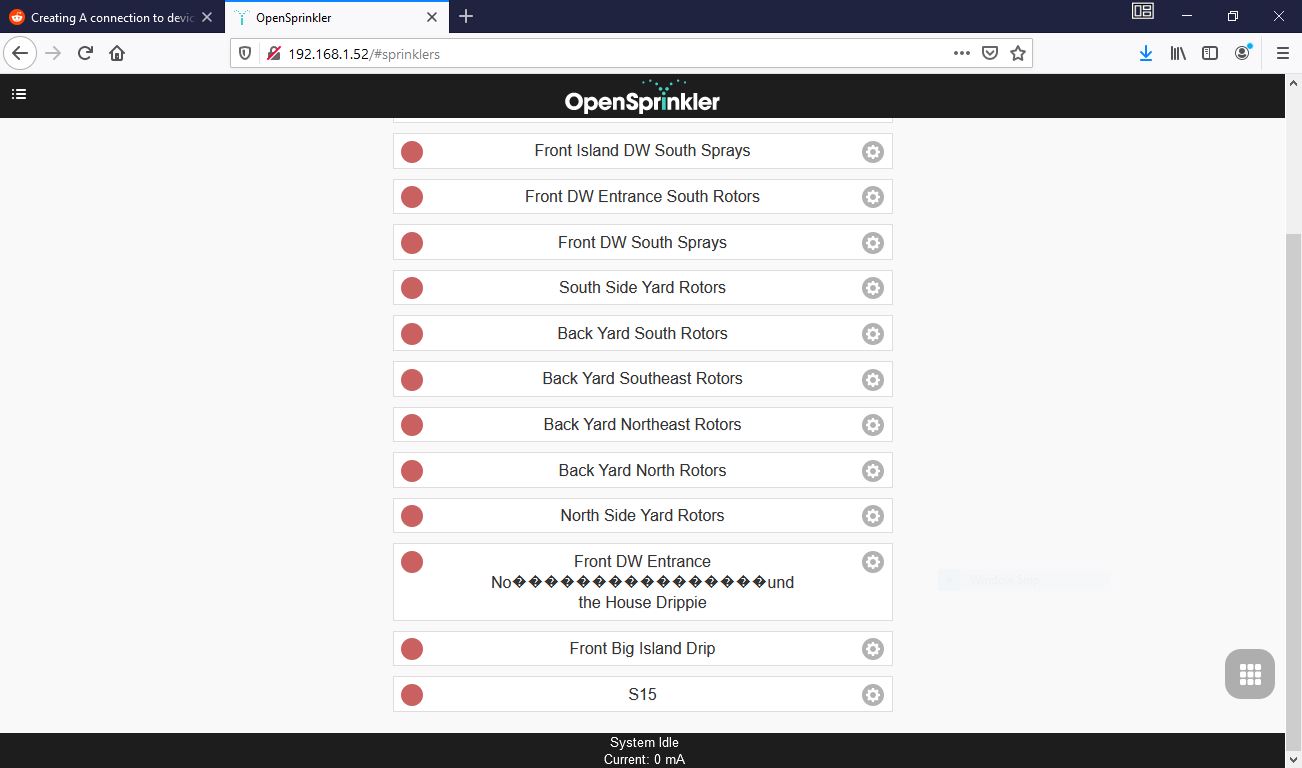
The zone name display was corrupt.
See attached file Web App.JPG
I then did a JA request. The corruption is particularly interesting because it spans fields causing 2 zone names to appear to be one with non-printing characters.
See attached ja.json.txt.
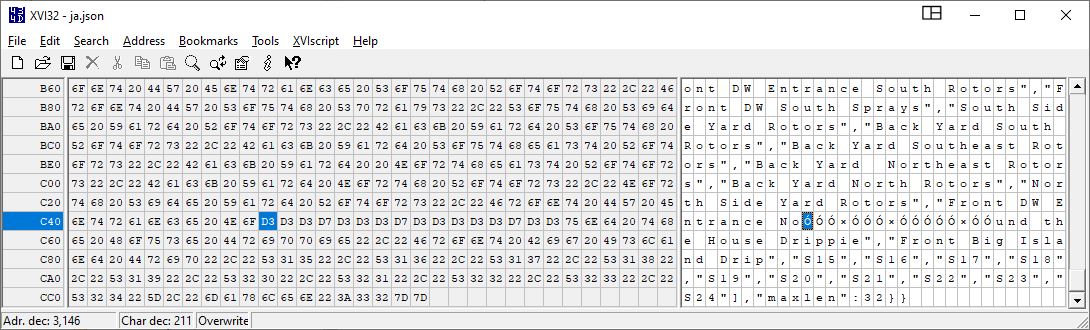
I have include a view of the he bad data in a HEX editor. Starting address of bad data is C4Ah
See attached ja.json.JPG
Finally I did a JN request, since its response is much shorter. I shows the zone data correctly.
See attached jn.json.txt.April 6, 2021 at 6:51 pm #69678
DaveCParticipantIn the previous post the file name ja.json.txt was changed to js.json-2.txt
I posted a note the was between my April 1 post and Ray’s April 6 response that has never appeared. It also had an attached file named js.json.txt which might account for the file name in this post change. I have no idea what happened to it.
At this level it shows 6 replies, but at the next higher level it shows 7. One got swallowed up.
April 7, 2021 at 5:56 am #69688
DaveCParticipantThis is the missing post from April 5.
A key symptom of the issue is when the web app or the phone app displays ‘Network Error’ in the bottom bar and the bar background becomes red. Does anyone know what conditions in the apps result in this error display?
I’m continuing to gather data about the corrupted JSON message data.
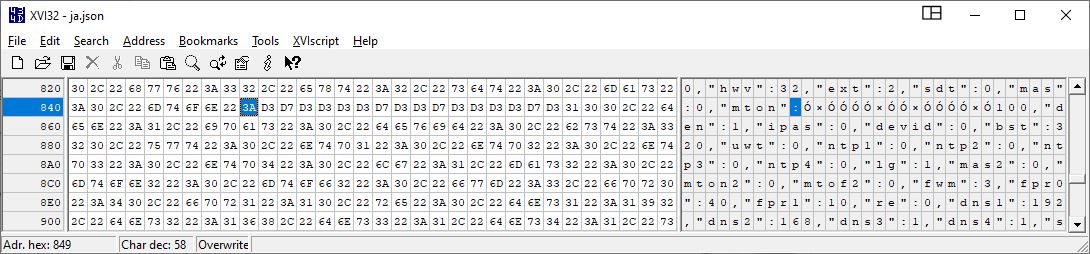
When I saw the ‘Network Error’ in the web app I stopped my app from polling so that the web app was the only client talking to OS. I then issued a JA request from a browser (firefox) and got back data that had unprintable data overwriting 16 characters in the response. I’ve attached 2 files to display what I saw in the full response (ja.json.45.txt) and a screen shot (ja.json.45.JPG) using a HEX editor to view the area with the bad data. The highlighted character is the character just before the 16 bytes of bad data The bad data starts at 84Ah (2122d)
I then issued each of the separate requests (JC, JO, JN, JS, JP) and they all came back correctly. I then issued JA again and it came back with the same bad data. FWIW, the responses to each of the separate requests are shorter than the position in the JA response where the bad data begins.I could not clear the ‘Network Error’ in the web app. I tried logging out of the web app, exiting the browser and logging back in. It came up with the ‘Network Error’. I tried using 2 different browsers. After the third browser attempt, OS became unresponsive. It would not respond to pings. After a few minutes it started responding to pings but I could not log in with the web app.
I then issued JA and all the individual requests. Most of the responses had bad data in them. Interestingly it occurred at the same position in the JSON message. The JA response had 2 instances of the bad data. Here’s a summary of the character positions that the 16 bytes of bad data starts in:
JA: 24Ah (586d), C4Ah (3146d)
JC: 24Ah (586d)
JN: 24Ah (586d)
JP: 24Ah (586d)
JO: No bad data. The length of this response is 234h (564d), which is less than the position of the bad data 24Ah (586d)
These files are available if desired.OS stays in this state. I can ping it. I can turn my app back on. It polls and gets responses with corrupt data. I can’t log into OS with the web app.
The various Jx requests issued via a browser return the bad responses noted in the previous paragraph.I was able to reboot OS using B2. After reboot all the response data was correct.
Dave
April 9, 2021 at 9:47 am #69716
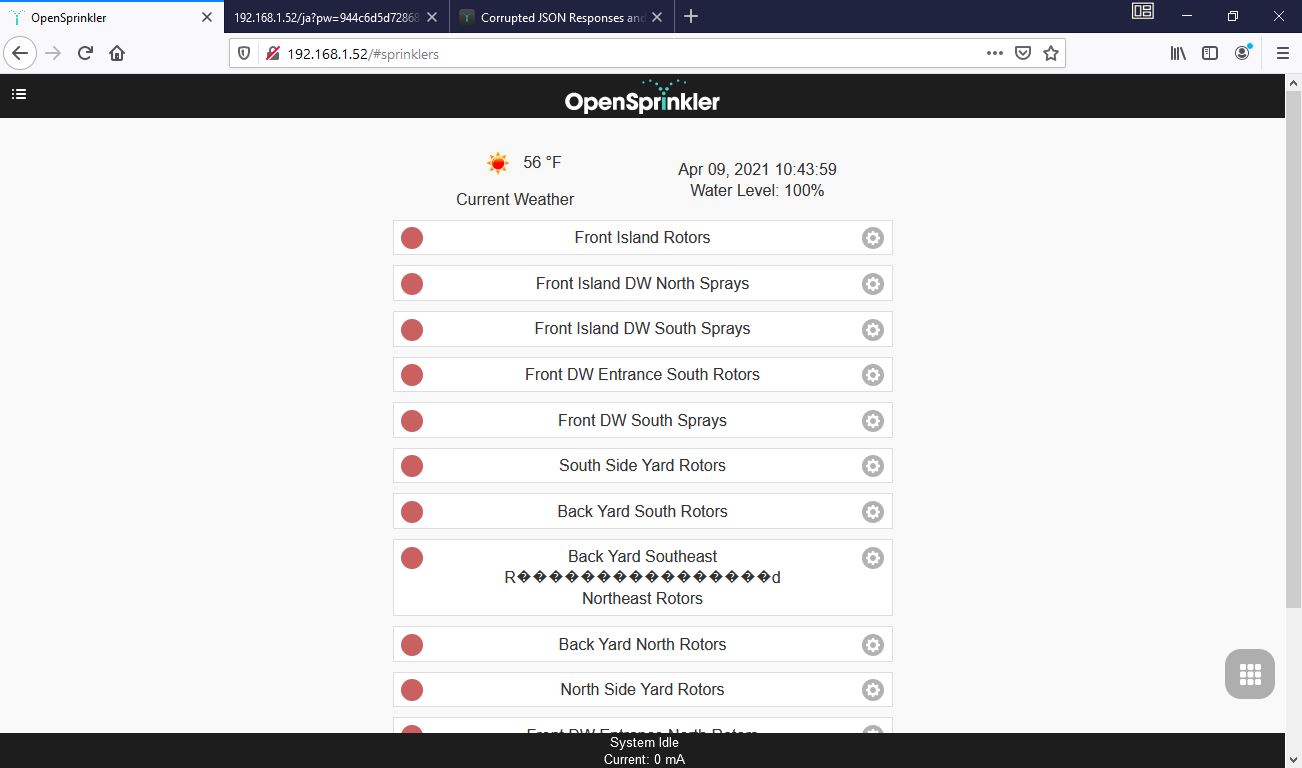
DaveCParticipantI ran OS wireless for 2 days. I did NOT see the JSON data corruption during that time. I just switched OS back to run wired and immediately saw the problem on the web app display and doing a JA command. Attached is the web app zone display.
Dave
Attachments:
April 9, 2021 at 11:18 am #69720
RayKeymasterIf you are already on firmware 2.1.9(7) then my guess is that this is likely due to a bad Ethernet module. You can submit a support ticket and we can arrange for sending you a new module, or if you want it faster you can get one from Amazon. It’s called enc28j60, get the 2×5 pin version (some are 2×6 pins which are not compatible).
April 18, 2021 at 10:23 am #69816
DaveCParticipantI’ve installed the new Ethernet Module, run for about 24 hours and tested some of the conditions that showed issues. I have NOT seen any issues. No Network Error messages or the corrupted JSON responses. Bad Ethernet Module, case closed. Thanks Ray for suggesting this as the problem and sending the module.
DaveApril 19, 2021 at 1:26 pm #69829
RayKeymasterThanks for posting the update.
-
AuthorPosts
- You must be logged in to reply to this topic.
OpenSprinkler › Forums › OpenSprinkler Unified Firmware › Corrupted JSON Responses and ‘Network Errors’